
Data, Reports, & Demographics
Rollins College provides data to assess diversity by various classifications of faculty, staff, and students. For us, inclusion is not about the numbers, it is about what we practice every day.
Reports
Learn how the Rollins College DEIB Strategic Plan is working to facilitate proactive campus cultural change to cultivate a more respectful, inclusive environment that embeds diversity, equity, inclusion, and belonging into the Rollins experience.

August 2023 State of the College Update
See the update on DEIB strategic implementation that was presented to the campus community at the August 2023 State of the College Open Forum.
Demographics
Explore key demographic data or take a deeper dive with the Diversity Dashboard.
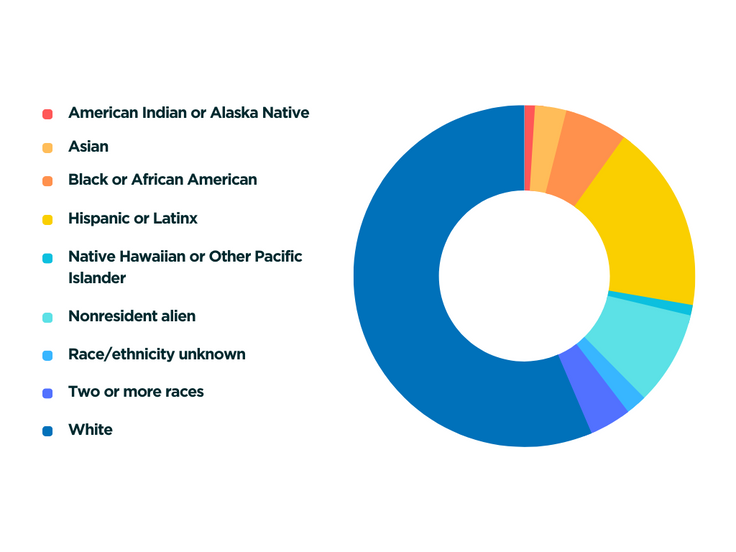
Fall 2022 Enrollment By Race/Ethnicity
>1% American Indian or Alaska Native
3% Asian
6% Black or African American
18% Hispanic of Latino
>1% Native Hawaiian or Other Pacific Islander
9% Nonresident alien
2% Race/ethnicity unknown
4% Two or more races
57% White
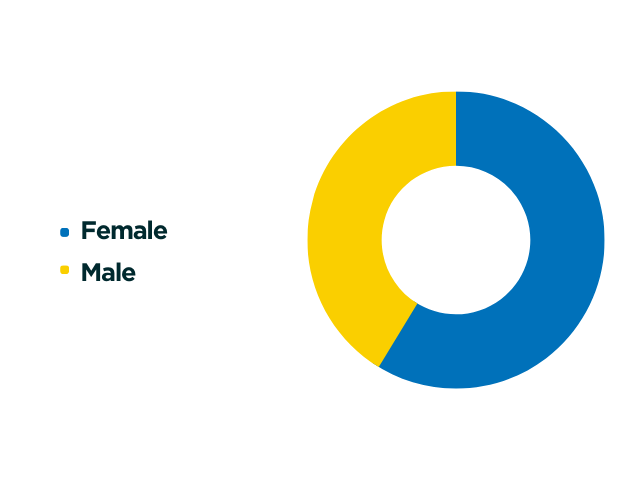
Fall 2022 Enrollment By Gender
58.8% Female
41.1% Male
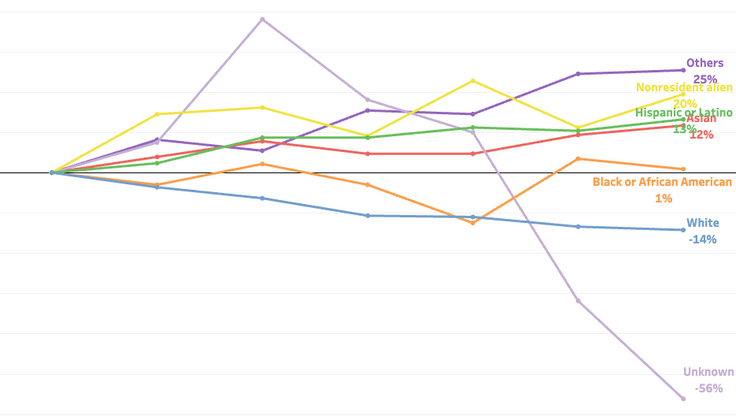
Diversity Dashboard
The Diversity Dashboard gives you an in-depth look at the demographic trends of the entire Rollins community since 2015.